

You can save the graph out as an image by right-clicking on the graph and choosing the appropriate option from the in-context menu. Also if you prefer to view and edit your graphs in Excel, there is another option for that as well.
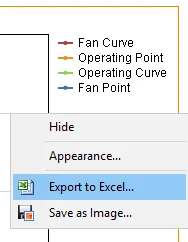
Image 3: Right-click options for the graph allow you to save it as an image or export it to Excel.
Derating a fan curve is a new feature in the 2020 release of SOLIDWORKS Flow Simulation. Fans are often set to run below their maximum capacity to reduce noise and increase their lifetime, but still achieve their thermal cooling requirements. Fans run at less than maximum capacity by reducing their RPMs, which derates the fan curve. The Derating factor (DF), see Image 4 below, simulates this reduction of the fan curve. The DF acts on the pressure difference, , and the flow rate, , like this:
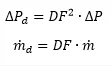
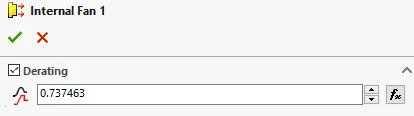
Image 4: The Derating factor is an option that can be set while defining or editing a fan on the Flow Simulation tree.
Since the Flow Simulation 2019 release, there is a new type of plot that you can show to see the operating point for any of the defined fans in a project. You can easily access this through a right-click on a specific fan and choosing “Show Operating Point” from the context menu, as shown in Image 1 below.
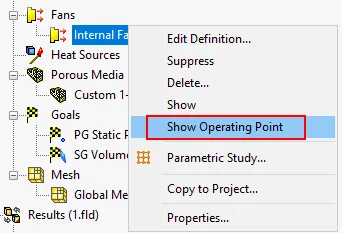
Image 1: Show Operating Point post-processing option from the right-click context menu of a defined fan.
In the graphics window, a graph will be shown that plots out four different parameters; see Image 2 below. It is easily resized by hovering your mouse over one of the four orange edges or corners until the mouse pointer changes, then click and drag. The four parameters (not in order) are:
- Fan Curve (maroon line) is the defined fan curve in the Engineering Database. If you used mass flow rate to define the fan, then the X-axis will be labeled as such.
- Operating Curve (light green line) is the derated operational curve that the simulation follows. If there is no derating defined for the fan, or it is 1, then it is the same as the fan curve. This curve may also be different if the reference density, if specified for the fan, is different than the density of the fluid that the fan encounters in the simulation.
- Operating Point (orange dot) is the point showing the actual operating flow rate of the fan based on the pressure difference that it experiences in the system.
- Fan Point (blue dot) is the point on the Fan Curve measured under certain normal conditions (i.e. derating and reference density are not taken into account).
- Note that the Operating Point is the most significant aspect of the graph, hence why the menu item refers to showing that specific point.
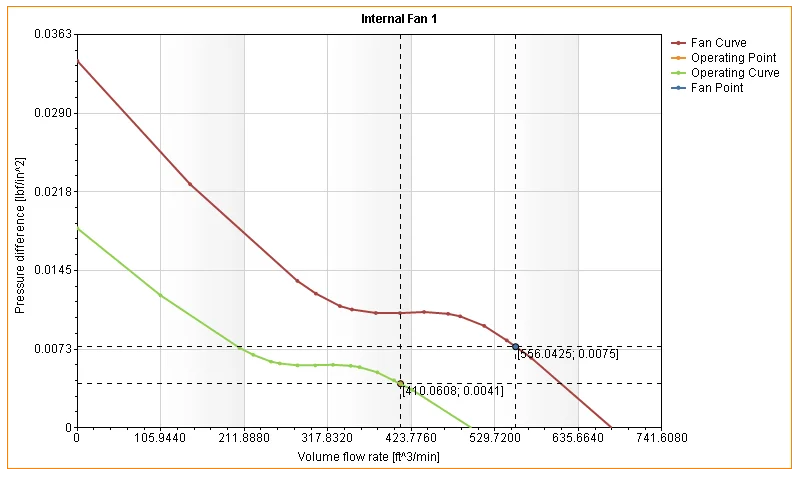
Image 2: Graph showing how Internal Fan 1 is interpreted in the project model.
You can save the graph out as an image by right-clicking on the graph and choosing the appropriate option from the in-context menu. Also if you prefer to view and edit your graphs in Excel, there is another option for that as well.
Image 3: Right-click options for the graph allow you to save it as an image or export it to Excel.
Derating a fan curve is a new feature in the 2020 release of SOLIDWORKS Flow Simulation. Fans are often set to run below their maximum capacity to reduce noise and increase their lifetime, but still achieve their thermal cooling requirements. Fans run at less than maximum capacity by reducing their RPMs, which derates the fan curve. The Derating factor (DF), see Image 4 below, simulates this reduction of the fan curve. The DF acts on the pressure difference, , and the flow rate, , like this:
Image 4: The Derating factor is an option that can be set while defining or editing a fan on the Flow Simulation tree.